Information coefficient: measuring whether a signal ranks future returns
A cross-sectional signal makes a relative statement. At a given observation time, it assigns higher scores to some securities and lower scores to others. The information coefficient asks whether that ordering was associated with the ordering of subsequent returns.
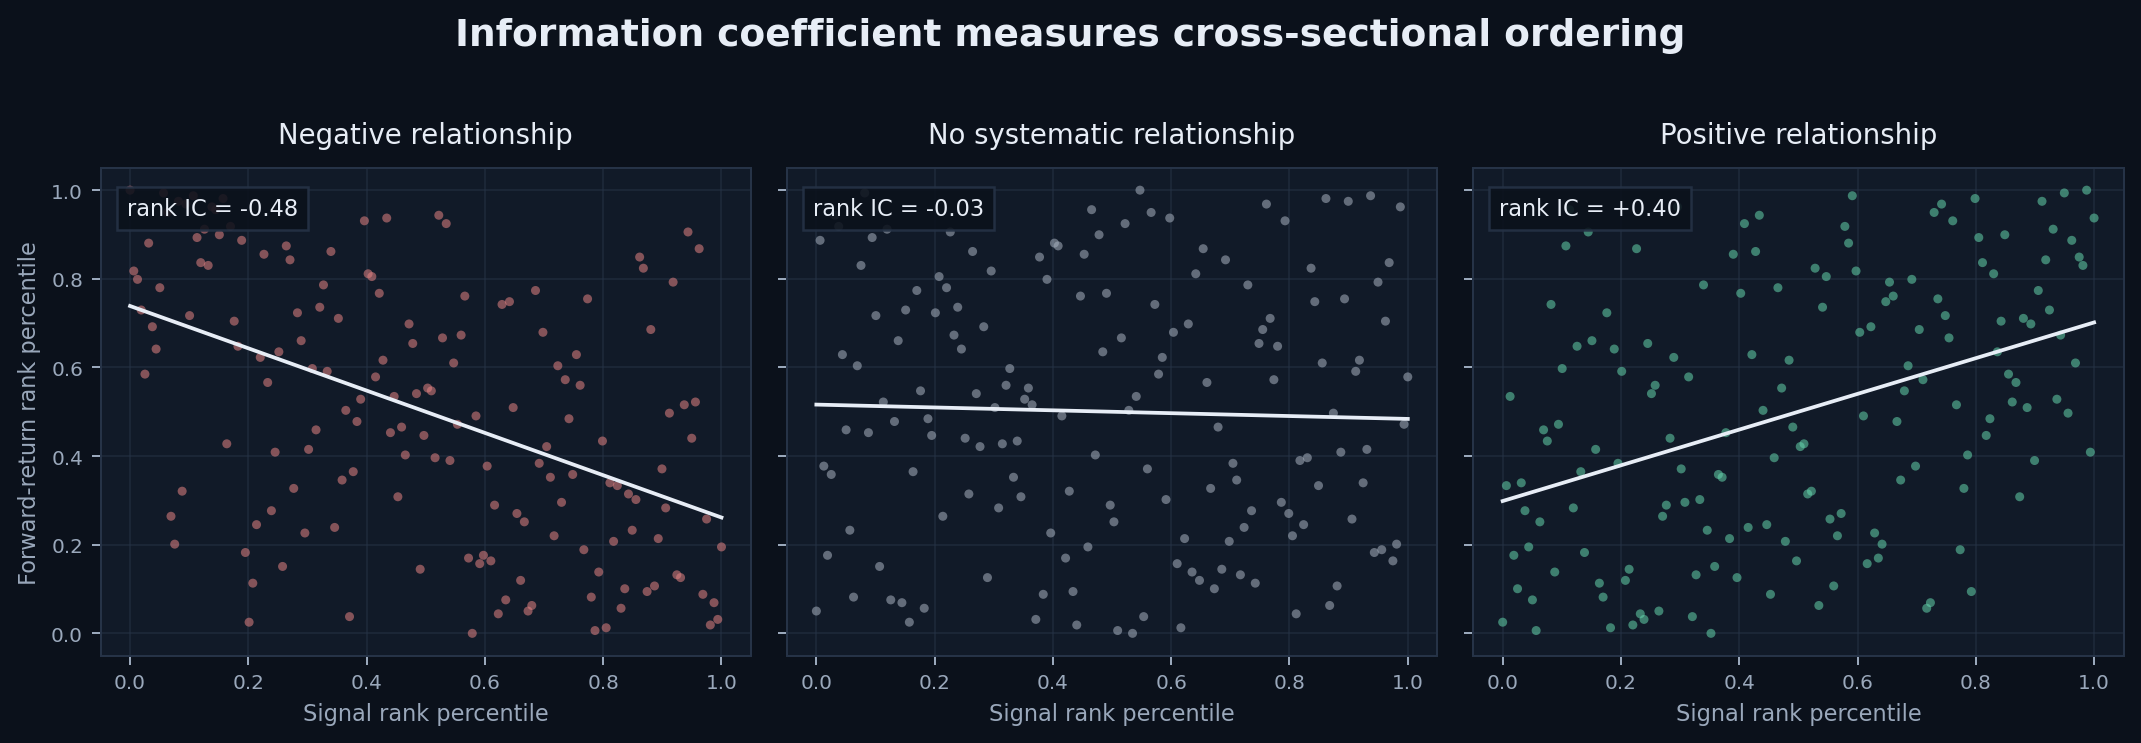
Consider a universe of 500 equities ranked at today's close. If the securities with higher signal scores tend to have higher next-period returns, the signal has a positive IC. If the ordering is unrelated to future returns, the IC is near zero. If the signal systematically ranks the eventual losers highest, its IC is negative.
Definition
Let \(f_{i,t}\) be the signal score for security \(i\) at time \(t\), and let \(r_{i,t+1}\) be its subsequent return over the stated forecast horizon. The cross-sectional Pearson IC is
\[\operatorname{IC}_{t} = \operatorname{corr}_{i} \left(f_{i,t},r_{i,t+1}\right).\]
The subscript \(i\) matters: the correlation is computed across securities at one observation time, not through time for one security.
In most factor research, rank IC is the more robust convention:
\[\operatorname{IC}^{\mathrm{rank}}_{t} = \operatorname{corr}_{i} \left( \operatorname{rank}(f_{i,t}), \operatorname{rank}(r_{i,t+1}) \right).\]
This is Spearman correlation. It measures whether the ordering is correct while placing less emphasis on the magnitude of extreme signal values or returns.
A practical reading of IC
IC is bounded by \(-1\) and \(1\):
- \(\operatorname{IC}=1\) means the signal and future-return rankings agree perfectly;
- \(\operatorname{IC}=0\) means there is no cross-sectional linear association between their ranks; and
- \(\operatorname{IC}=-1\) means the rankings are exactly reversed.
Real financial signals generally operate much closer to zero. There is no universal threshold that separates a useful signal from a useless one. Economic value also depends on the universe, holding period, breadth, turnover, portfolio construction, capacity, and transaction costs.
A small positive IC can still be relevant when it is observed consistently across many dates and securities. A larger IC observed only once provides less evidence about persistence.
One date is not a research result
Daily cross-sectional IC is noisy. Changes in the investment universe, return dispersion, market regime, sector composition, and individual security events can move the statistic substantially from one date to the next.
For that reason, research usually examines the IC time series rather than one observation. Common summaries include:
- the mean and median IC;
- the fraction of dates with positive IC;
- the standard deviation of IC;
- rolling mean IC;
- rolling ICIRRolling ICIRThe mean information coefficient divided by its standard deviation over a trailing window, usually annualized. It measures the persistence of ranking skill rather than one period’s IC.Open glossary entry →; and
- stability by year, sector, liquidity group, and market regime.
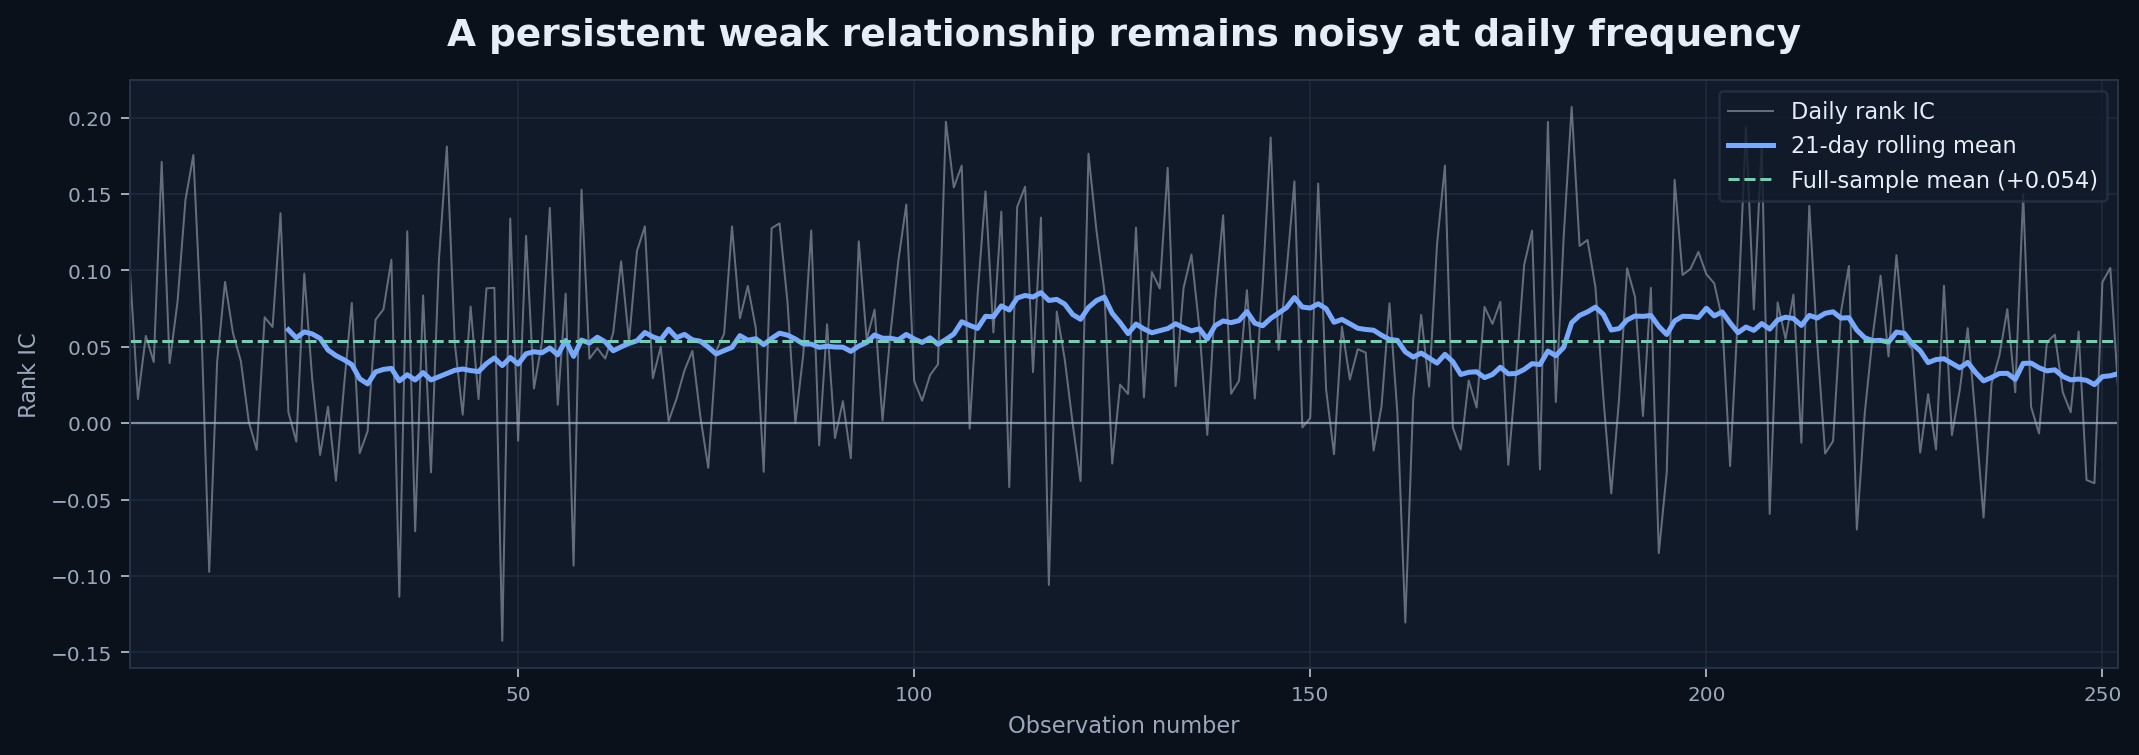
The figure illustrates why a signal cannot be assessed from a handful of favorable observations. It also shows why the selected rolling window matters: short windows respond quickly but have greater sampling variation; long windows are more stable but may conceal deterioration.
The forecast horizon must be explicit
The return label defines the question being tested. A signal can have positive IC for next-day returns and no IC for returns over the following month, or the reverse. Results are not comparable unless they use the same:
- observation time;
- return horizon;
- treatment of overlapping labels;
- universe and liquidity filters;
- corporate-action convention; and
- lag between signal availability and portfolio formation.
A point-in-time signal must be paired with a return that begins only after the signal was observable. Otherwise the estimated IC may contain look-ahead bias.
Rank IC versus Pearson IC
Pearson IC uses raw values. It is appropriate when the magnitude of the signal is intended to be meaningful and the relationship is approximately linear. It can be dominated by a small number of extreme observations.
Rank IC uses ordering. It is often preferred for cross-sectional equity factors because factor scores are frequently winsorized, normalized, or converted to quantiles before portfolio construction. Rank IC is invariant to any strictly monotonic transformation of the signal.
The two statistics answer related but different questions:
- Pearson IC asks whether signal magnitude is linearly associated with return magnitude.
- Rank IC asks whether higher signal values generally correspond to higher subsequent returns.
Both conventions should identify their treatment of missing values, ties, and minimum cross-sectional sample size.
IC is not portfolio return
IC evaluates a forecast before a complete portfolio has been constructed. It does not incorporate:
- the size of long and short positions;
- neutralization and portfolio constraints;
- covariance between positions;
- turnover and transaction costs;
- borrow availability; or
- market impact.
A signal may have a positive IC but produce an unattractive portfolio after costs. Conversely, a modest IC applied across a broad, liquid universe may support a useful portfolio. IC is therefore one item in the evidence chain, not a substitute for a point-in-time portfolio backtest.
Use in StrategyNet
StrategyNet stores a time series of IC observations for each FMP candidate. The allocator does not use the latest IC in isolation. It derives an expected-return score from rolling ICIRRolling ICIRThe mean information coefficient divided by its standard deviation over a trailing window, usually annualized. It measures the persistence of ranking skill rather than one period’s IC.Open glossary entry →, which rewards a positive mean IC and penalizes instability across the selected window.
The distinction is practical:
- IC measures ranking performance on one observation date;
- mean IC estimates average ranking performance over a sample; and
- rolling ICIR scales that mean by its variability.
The resulting score is still an estimate. It is combined with covariance, constraints, and, where selected, empirical tail-loss penalties in the robust portfolio optimization workflow.
This walkthrough is for research and educational purposes. It illustrates how StrategyNet organizes signal evidence into factors and scenarios; it is not a recommendation, investment advice, or an instruction to trade any security.
See plans